function VBR = CB_001_0D_scalar()
%%%%%%%%%%%%%%%%%%%%%%%%%%%%%%%%%%%%%%%%%%%%%%%%%%%%%%%%%%%%%%%%%%%%%%%%%%%
% CB_001_0D_scalar.m
%
% Calls VBR Calculator using a single thermodynamic state for a range of
% frequency.
%%%%%%%%%%%%%%%%%%%%%%%%%%%%%%%%%%%%%%%%%%%%%%%%%%%%%%%%%%%%%%%%%%%%%%%%%%%
%% write method list for each property type to calculate %%
% all methods will end up as output like:
% VBR.out.elastic.anharmonic, VBR.out.anelastic.eBurgers, etc.
VBR.in.elastic.methods_list={'anharmonic';'anh_poro'};
VBR.in.viscous.methods_list={'HK2003'};
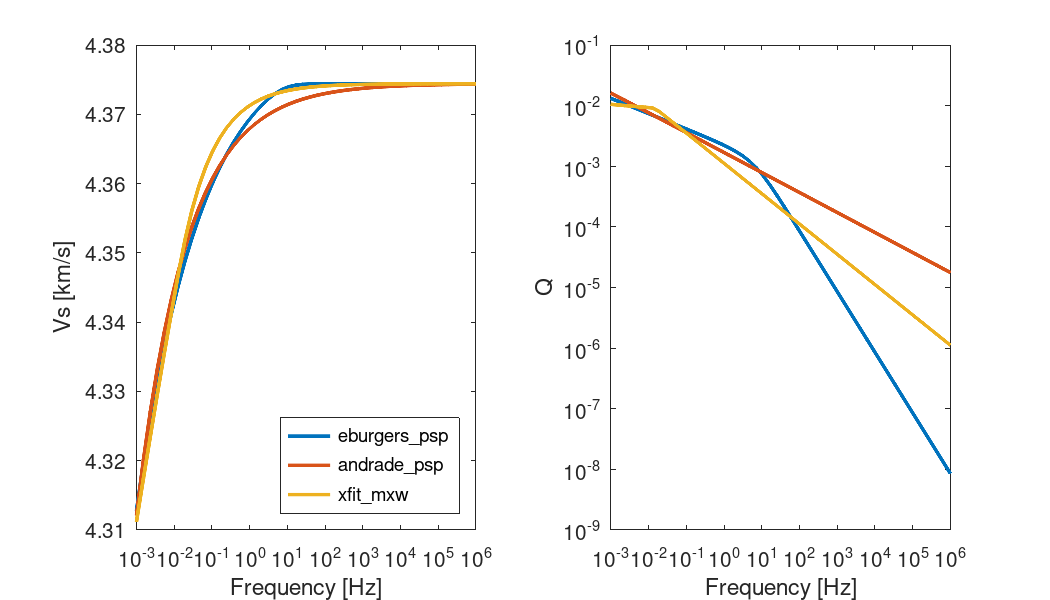
VBR.in.anelastic.methods_list={'eburgers_psp';'andrade_psp';'xfit_mxw'};
%% load anharmonic parameters, adjust Gu_0_ol %%
% all params in ../vbr/vbrCore/params will be loaded in call to VBR spine,
% but you can load them here and adjust any one of them (rather than changing
% those parameter files).
VBR.in.elastic.anharmonic=Params_Elastic('anharmonic'); % unrelaxed elasticity
VBR.in.elastic.anharmonic.Gu_0_ol = 75.5; % olivine ref. shear modulus [GPa]
%% Define the Thermodynamic State %%
% size of the state variable arrays. arrays can be any shape
% but all arays must be the same shape.
n1 = 1;
% set state variables
VBR.in.SV.P_GPa = 2 * ones(n1,1); % pressure [GPa]
VBR.in.SV.T_K = 1473 * ones(n1,1); % temperature [K]
VBR.in.SV.rho = 3300 * ones(n1,1); % density [kg m^-3]
VBR.in.SV.sig_MPa = 10 * ones(n1,1); % differential stress [MPa]
VBR.in.SV.phi = 0.0 * ones(n1,1); % melt fraction
VBR.in.SV.dg_um = 0.01 * 1e6 * ones(n1,1); % grain size [um]
% frequencies to calculate at
VBR.in.SV.f = logspace(-3,0,50);
%% CALL THE VBR CALCULATOR %%
[VBR] = VBR_spine(VBR) ;
%% Build plots %%
if ~vbr_tests_are_running()
figure('PaperPosition',[0,0,7,4],'PaperPositionMode','manual')
% Loop over anelastic methods, plot result of each
for imeth=1:numel(VBR.in.anelastic.methods_list)
ane_meth=VBR.in.anelastic.methods_list{imeth};
% pull out V and Q for this method by selecting field dynamically
Vs=VBR.out.anelastic.(ane_meth).V/1e3;
Q=VBR.out.anelastic.(ane_meth).Q;
% add this method to the plots
subplot(1,2,1)
hold all
name_label=strrep(ane_meth,'_','\_');
semilogx(VBR.in.SV.f,Vs,'linewidth',2,'DisplayName',name_label)
subplot(1,2,2)
hold all
loglog(VBR.in.SV.f,Q,'linewidth',2,'DisplayName',name_label)
end
subplot(1,2,1)
xlabel('Frequency [Hz]'); ylabel('Vs [km/s]'); legend('location','southeast')
box on;
subplot(1,2,2)
xlabel('Frequency [Hz]'); ylabel('Q'); box on
saveas(gcf,'./figures/CB_001_0D_scalar.png')
end
end