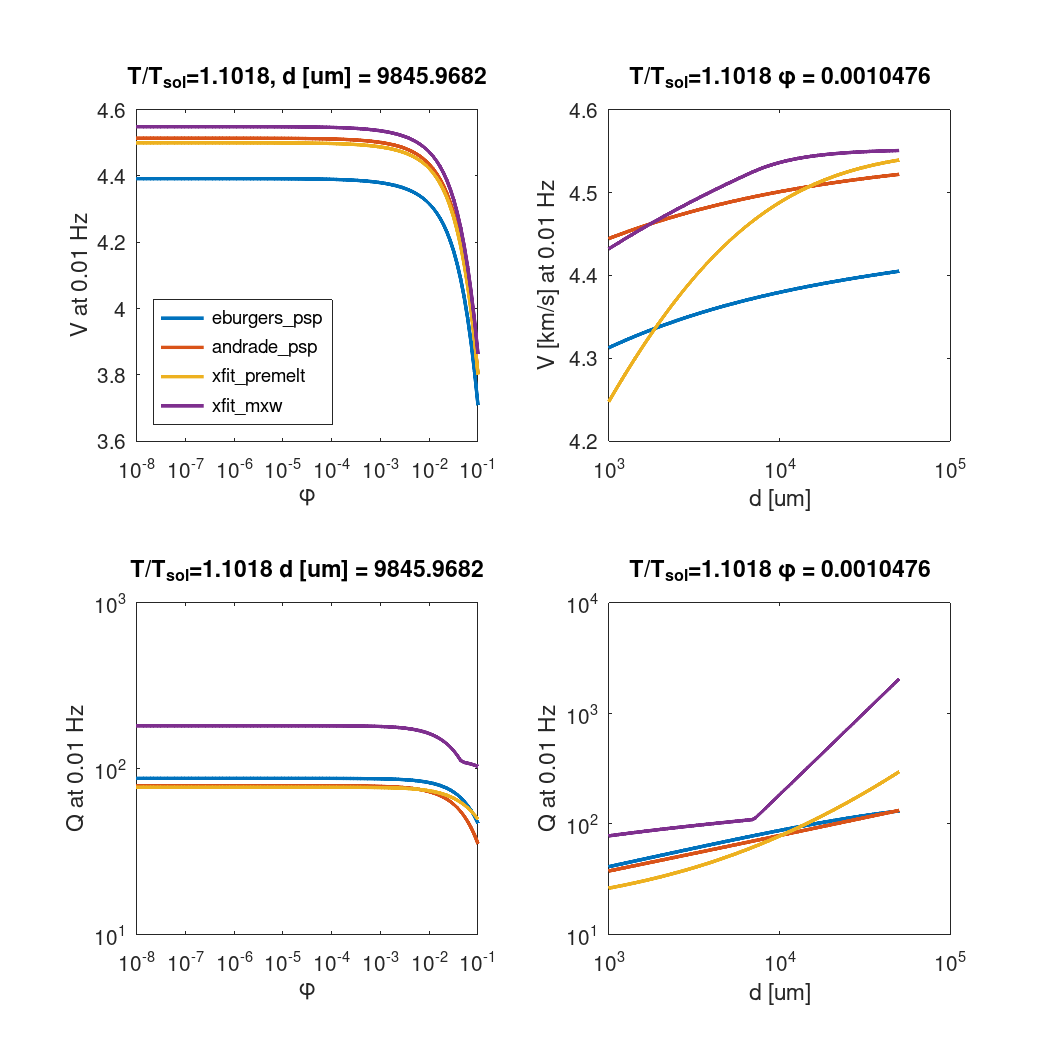
function VBR = CB_005_grainsize_melt()
  %%%%%%%%%%%%%%%%%%%%%%%%%%%%%%%%%%%%%%%%%%%%%%%%%%%%%%%%%%%%%%%%%%%%%%%%%%%
  % CB_005_grainsize_melt.m
  %
  %  Calculates anelastic properties for all methods and a range of grain
  %  size and melt fraction.
  %%%%%%%%%%%%%%%%%%%%%%%%%%%%%%%%%%%%%%%%%%%%%%%%%%%%%%%%%%%%%%%%%%%%%%%%%%%

  %% write method lists, adjust parameters %%
  VBR.in.elastic.methods_list={'anharmonic';'anh_poro'};
  VBR.in.viscous.methods_list={'HZK2011'};
  VBR.in.anelastic.methods_list={'eburgers_psp';'andrade_psp';'xfit_premelt';'xfit_mxw'};
  VBR.in.anelastic.eburgers_psp.eBurgerFit='bg_peak';

  %% Define the Thermodynamic State %%
  % build grid of dg and phi
  dg_um=logspace(-3,-1.3,90)*1e6; % grain size [um] (1 mm to 5 cm)
  phi = logspace(-8,-1,100);
  [VBR.in.SV.dg_um,VBR.in.SV.phi]=meshgrid(dg_um,phi);

  % size of the state variable arrays to initialize remainign state variables
  sz=size(VBR.in.SV.dg_um);

  % remaining state variables
  VBR.in.SV.T_K=(1350+273) * ones(sz); % temperature [K]
  VBR.in.SV.P_GPa = 3.2 * ones(sz); % pressure [GPa]
  VBR.in.SV.rho = 3300 * ones(sz); % density [kg m^-3]
  VBR.in.SV.sig_MPa = 0.1 * ones(sz); % differential stress [MPa]
  VBR.in.SV.Tsolidus_K=1200+273*ones(sz);
  Thomol=VBR.in.SV.T_K ./ VBR.in.SV.Tsolidus_K;
  Thomol=Thomol(1); % for reference for later...
  VBR.in.SV.f = 0.01; %  frequencies to calculate at

  %% CALL THE VBR CALCULATOR %%
  [VBR] = VBR_spine(VBR) ;

  %% Build Plots %%
  if ~vbr_tests_are_running()
    figure('Position', [10 10 650 650],'PaperPosition',[0,0,7,7],'PaperPositionMode','manual');
    fixed_dg=.01 * 1e6; % 1 cm grain size
    fixed_phi=.001; % melt fraction
    [val,iphi]=min(abs(phi-fixed_phi));
    [val,idg]=min(abs(dg_um-fixed_dg));
    for imeth=1:numel(VBR.in.anelastic.methods_list)
      meth=VBR.in.anelastic.methods_list{imeth};
      V=VBR.out.anelastic.(meth).V/1e3;
      Q=VBR.out.anelastic.(meth).Q;
      subplot(2,2,1)
      hold all
      methname=strrep(meth,'_','\_');
      semilogx(phi,V(:,idg),'DisplayName',methname,'linewidth',2)
      box on
      xlabel('\phi')
      ylabel(['V at ',num2str(VBR.in.SV.f),' Hz'])
      title(['T/T_{sol}=',num2str(Thomol),', d [um] = ',num2str(dg_um(idg))])

      subplot(2,2,2)
      hold all
      methname=strrep(meth,'_','\_');
      semilogx(dg_um,V(iphi,:),'DisplayName',methname,'linewidth',2)
      box on
      xlabel('d [um]')
      ylabel(['V [km/s] at ',num2str(VBR.in.SV.f),' Hz'])
      title(['T/T_{sol}=',num2str(Thomol),' \phi = ',num2str(phi(iphi))])

      subplot(2,2,3)
      hold all
      methname=strrep(meth,'_','\_');
      loglog(phi,Q(:,idg),'DisplayName',methname,'linewidth',2)
      box on
      xlabel('\phi')
      ylabel(['Q at ',num2str(VBR.in.SV.f),' Hz'])
      title(['T/T_{sol}=',num2str(Thomol),' d [um] = ',num2str(dg_um(idg))])

      subplot(2,2,4)
      hold all
      methname=strrep(meth,'_','\_');
      loglog(dg_um,Q(iphi,:),'DisplayName',methname,'linewidth',2)
      box on
      xlabel('d [um]')
      ylabel(['Q at ',num2str(VBR.in.SV.f),' Hz'])
      title(['T/T_{sol}=',num2str(Thomol),' \phi = ',num2str(phi(iphi))])
    end

    subplot(2,2,1)
    legend('location','southwest')
    saveas(gcf,'./figures/CB_005_grainsize_melt.png')
  end
end
