function Results = CB_011_meltEffects(case2run)
%%%%%%%%%%%%%%%%%%%%%%%%%%%%%%%%%%%%%%%%%%%%%%%%%%%%%%%%%%%%%%%%%%%%%%%%%%%
% Results = CB_011_meltEffects(case2run)
%
% VBR Calculations illustrating melt dependence of various methods.
%
% Parameters
% ----------
% case2run string, can be 'all','case1' or 'case2'
% 'case1' : demonstrates poroelastic effect, compares to
% anelastic dependence on melt fraction
% 'case2' : demonstrates small-melt effect on anelastic
% properties and compares to pre-melting method
%
% Output
% ------
% Results structure with figure handles and VBR results for each case
% Also prints figures to screen
%%%%%%%%%%%%%%%%%%%%%%%%%%%%%%%%%%%%%%%%%%%%%%%%%%%%%%%%%%%%%%%%%%%%%%%%%%%
% run the cases
if ~exist('case2run')
case2run='all';
end
if strcmp(case2run,'case1') || strcmp(case2run,'all')
Results.case1=case1(); % Case 1: poro-elastic effect
end
if strcmp(case2run,'case2') || strcmp(case2run,'all')
Results.case2=case2(); % Case 2: small-melt effect vs pre-melting
end
end
function case1out = case1()
%%%%%%%%%%%%%%%%%%%%%%%%%%%%%%%%%%%%%%%%%%%%%%%%%%%%%%%%%%%%%%%%%%%%%%%%%%%
% case1out = case1()
%
% demonstrates poroelastic effect, compares to anelastic dependence on melt
% fraction
%
% Output
% ------
% case1out structure with various VBR structures and figure handles
%%%%%%%%%%%%%%%%%%%%%%%%%%%%%%%%%%%%%%%%%%%%%%%%%%%%%%%%%%%%%%%%%%%%%%%%%%%
% Call VBR with 'anharmonic' and 'anh_poro' elastic methods
VBR.in.elastic.methods_list={'anharmonic';'anh_poro'};
VBR.in.viscous.methods_list={'HZK2011'};
VBR.in.anelastic.methods_list={'eburgers_psp';'andrade_psp';'xfit_mxw';'xfit_premelt'};
VBR.in.SV.phi=logspace(-6,-1.5,100);
VBR = appendFixedSVs(VBR,size(VBR.in.SV.phi));
VBR.in.SV.T_K=1200+273*ones(size(VBR.in.SV.phi));
T_N=1.01;
VBR.in.SV.Tsolidus_K=VBR.in.SV.T_K/T_N;
VBR_1 = VBR_spine(VBR);
% figure: effect on unrelaxed modulus, wavespeed
if ~vbr_tests_are_running()
case1out.fig1=figure('Position', [10 10 650 250]);
for imeth=1:numel(VBR_1.in.elastic.methods_list)
elmeth=VBR_1.in.elastic.methods_list{imeth};
mnme=strrep(elmeth,'_','\_');
subplot(1,2,1)
hold all
semilogx(VBR_1.in.SV.phi,VBR_1.out.elastic.(elmeth).Gu/1e9,'DisplayName',mnme,'linewidth',2)
subplot(1,2,2)
hold all
semilogx(VBR_1.in.SV.phi,VBR_1.out.elastic.(elmeth).Vsu/1e3,'DisplayName',mnme,'linewidth',2)
end
subplot(1,2,1)
xlabel('\phi'); ylabel('Unrelaxed Gu [GPa]'); box on; legend('location','southwest')
subplot(1,2,2)
xlabel('\phi'); ylabel('Unrelaxed Vsu [km/s]'); box on;
end
% Call VBR again, only adjust elastic methods
VBR.in.elastic.methods_list={'anharmonic'};
VBR_2 = VBR_spine(VBR);
if ~vbr_tests_are_running()
% figure: anelastic results with and without poroelastic effect
case1out.fig2=figure('Position', [20 20 650 250]);
ifreq=1;
meth_colors=getMethodColors();
phi_range=VBR.in.SV.phi;
for imeth=1:numel(VBR_1.in.anelastic.methods_list)
anemeth=VBR_1.in.anelastic.methods_list{imeth};
mnme1=strrep(anemeth,'_','\_');
c=meth_colors.(anemeth);
subplot(1,2,1)
hold on
GuRat1=squeeze(VBR_1.out.anelastic.(anemeth).M(1,:,ifreq))/1e9;%./VBR_1.out.elastic.anh_poro.Gu;
GuRat2=squeeze(VBR_2.out.anelastic.(anemeth).M(1,:,ifreq))/1e9;%./VBR_2.out.elastic.anharmonic.Gu;
semilogx(phi_range,GuRat1,c,'DisplayName',mnme1,'linewidth',2)
mnme=[mnme1,', anh only'];
semilogx(phi_range,GuRat2,['--',c],'DisplayName',mnme,'linewidth',2)
subplot(1,2,2)
hold on
VRat1=squeeze(VBR_1.out.anelastic.(anemeth).V(1,:,ifreq))/1e3;%./VBR_1.out.elastic.anh_poro.Vsu;
VRat2=squeeze(VBR_2.out.anelastic.(anemeth).V(1,:,ifreq))/1e3;%./VBR_2.out.elastic.anharmonic.Vsu;
semilogx(phi_range,VRat1,c,'DisplayName',mnme1,'linewidth',2)
mnme=[mnme1,', anh only'];
semilogx(phi_range,VRat2,['--',c],'DisplayName',mnme,'linewidth',2)
end
subplot(1,2,1)
box on; xlabel('\phi'); ylabel('M [GPa]'); legend('location','southwest')
subplot(1,2,2)
box on; xlabel('\phi'); ylabel('Vs_R [km/]');
end
case1out.VBR_1=VBR_1;
case1out.VBR_2=VBR_2;
end
function case2out =case2()
%%%%%%%%%%%%%%%%%%%%%%%%%%%%%%%%%%%%%%%%%%%%%%%%%%%%%%%%%%%%%%%%%%%%%%%%%%%
% case2out = case2()
%
% demonstrates small-melt effect on anelastic properties and compares to
% pre-melting method
%
% Output
% ------
% case2out structure with various VBR structures and figure handles
%%%%%%%%%%%%%%%%%%%%%%%%%%%%%%%%%%%%%%%%%%%%%%%%%%%%%%%%%%%%%%%%%%%%%%%%%%%
% first, calculate with/without melt effect for relevant methods
VBR.in.elastic.methods_list={'anharmonic';'anh_poro'};
VBR.in.viscous.methods_list={'HZK2011'};
VBR.in.anelastic.methods_list={'eburgers_psp';'andrade_psp';'xfit_mxw';'xfit_premelt'};
VBR.in.GlobalSettings.melt_enhancement=0; % (the default value)
VBR.in.SV.phi=logspace(-8,-1.5,100);
VBR = appendFixedSVs(VBR,size(VBR.in.SV.phi));
T_solidus_C=1300;
VBR.in.SV.T_K=T_solidus_C+273*ones(size(VBR.in.SV.phi));
T_N=1.01;
VBR.in.SV.Tsolidus_K=VBR.in.SV.T_K/T_N;
VBR_1 = VBR_spine(VBR);
phi_c=VBR_1.in.GlobalSettings.phi_c(1);
VBR.in.GlobalSettings.melt_enhancement=1;
VBR_2 = VBR_spine(VBR);
case2out.VBR_1=VBR_1;
case2out.VBR_2=VBR_2;
% figure: V,M vs. melt fraction for each method
if ~vbr_tests_are_running()
case2out.fig=figure('Position', [10 10 650 250]);
ifreq=1;
meth_colors=getMethodColors();
phi_range=VBR.in.SV.phi;
for imeth=1:numel(VBR_1.in.anelastic.methods_list)
anemeth=VBR_1.in.anelastic.methods_list{imeth};
mnme1=strrep(anemeth,'_','\_');
c=meth_colors.(anemeth);
subplot(1,3,1)
hold on
GuRat1=squeeze(VBR_1.out.anelastic.(anemeth).M(1,:,ifreq))/1e9;%./VBR_1.out.elastic.anh_poro.Gu;
GuRat2=squeeze(VBR_2.out.anelastic.(anemeth).M(1,:,ifreq))/1e9;%./VBR_2.out.elastic.anharmonic.Gu;
semilogx(phi_range,GuRat1,c,'DisplayName',mnme1,'linewidth',2)
mnme=[mnme1,', melt effect'];
semilogx(phi_range,GuRat2,['--',c],'DisplayName',mnme,'linewidth',2)
subplot(1,3,2)
hold on
VRat1=squeeze(VBR_1.out.anelastic.(anemeth).V(1,:,ifreq))/1e3;%./VBR_1.out.elastic.anh_poro.Vsu;
VRat2=squeeze(VBR_2.out.anelastic.(anemeth).V(1,:,ifreq))/1e3;%./VBR_2.out.elastic.anharmonic.Vsu;
semilogx(phi_range,VRat1,c,'DisplayName',mnme1,'linewidth',2)
mnme=[mnme1,', anh only'];
semilogx(phi_range,VRat2,['--',c],'DisplayName',mnme,'linewidth',2)
subplot(1,3,3)
hold on
Q1=squeeze(VBR_1.out.anelastic.(anemeth).Q(1,:,ifreq))/1e3;%./VBR_1.out.elastic.anh_poro.Vsu;
Q2=squeeze(VBR_2.out.anelastic.(anemeth).Q(1,:,ifreq))/1e3;%./VBR_2.out.elastic.anharmonic.Vsu;
loglog(phi_range,Q1,c,'DisplayName',mnme1,'linewidth',2)
mnme=[mnme1,', anh only'];
loglog(phi_range,Q2,['--',c],'DisplayName',mnme,'linewidth',2)
end
subplot(1,3,1)
box on; xlabel('\phi'); ylabel('M [GPa]'); legend('location','southwest')
subplot(1,3,2)
box on; xlabel('\phi'); ylabel('Vs_R [km/s]');
subplot(1,3,3)
box on; xlabel('\phi'); ylabel('Q');
end
% now compare to pre-melt method (which is independent of the melt effect)
VBR.in.anelastic.methods_list={'eburgers_psp';'andrade_psp';'xfit_mxw';'xfit_premelt'};
VBR.in.SV=struct(); % clear it out, size will be changing...
Tmax=1400; Tmin=800;
VBR.in.SV.T_K=[linspace(Tmin,999,20),linspace(1000,Tmax,500)]+273;
VBR.in.SV.Tsolidus_K=T_solidus_C+273;
VBR.in.SV.phi=1e-4*((VBR.in.SV.T_K-VBR.in.SV.Tsolidus_K));
VBR.in.SV.phi(VBR.in.SV.phi<0)=1e-16;
VBR.in.SV.phi(VBR.in.SV.phi>1)=1;
VBR = appendFixedSVs(VBR,size(VBR.in.SV.phi));
VBR_3 = VBR_spine(VBR);
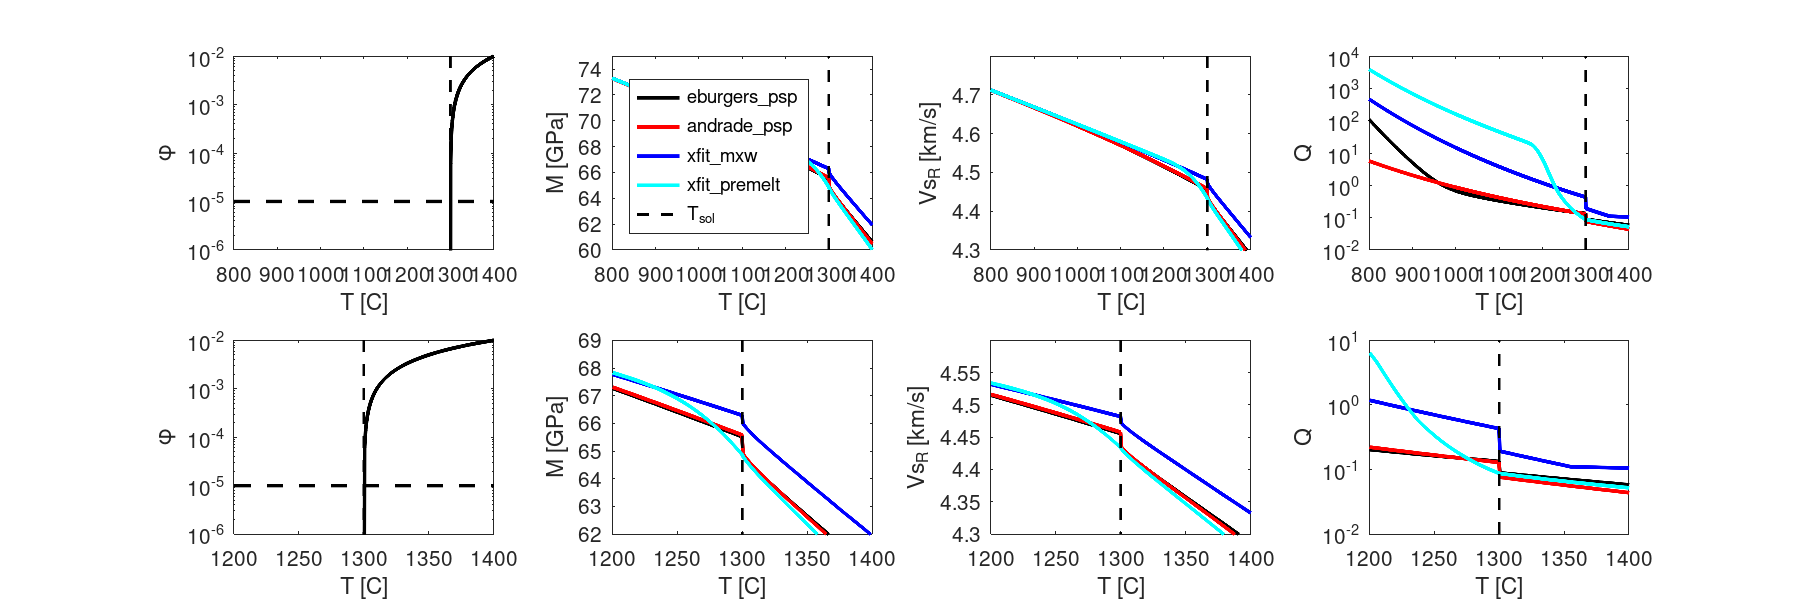
% figure: phi, M and V vs T
if ~vbr_tests_are_running()
case2out.fig2=figure('Position', [30 30 1000 500],'PaperPosition',[0,0,12,4],'PaperPositionMode','manual');
meth_colors=getMethodColors();
phi_range=VBR.in.SV.phi;
Trange=VBR_3.in.SV.T_K-273;
subplot(2,4,1)
semilogy(Trange,phi_range,'k','linewidth',2)
hold on
phiminax=[min(phi_range),max(phi_range)];
Tminmax=[min(Trange),max(Trange)];
semilogy([T_solidus_C,T_solidus_C],phiminax,'--k','linewidth',1.5)
semilogy(Tminmax,[phi_c,phi_c],'--k','linewidth',2)
ylabel('\phi'); xlabel('T [C]');
xlim([Tmin,Tmax])
ylim([1e-6,1e-2])
subplot(2,4,5)
Tmin2=1200;
Tmask=(Trange>=Tmin2);
semilogy(Trange(Tmask),phi_range(Tmask),'k','linewidth',2)
hold on
phiminax=[min(phi_range),max(phi_range)];
Tminmax=[min(Trange(Tmask)),max(Trange(Tmask))];
semilogy([T_solidus_C,T_solidus_C],phiminax,'--k','linewidth',1.5)
semilogy(Tminmax,[phi_c,phi_c],'--k','linewidth',2)
ylabel('\phi'); xlabel('T [C]');
xlim([Tmin2,Tmax])
ylim([1e-6,1e-2])
for imeth=1:numel(VBR_3.in.anelastic.methods_list)
anemeth=VBR_3.in.anelastic.methods_list{imeth};
mnme1=strrep(anemeth,'_','\_');
c=meth_colors.(anemeth);
subplot(2,4,2)
hold on
GuRat1=squeeze(VBR_3.out.anelastic.(anemeth).M(1,:,ifreq))/1e9;%./VBR_1.out.elastic.anh_poro.Gu;
plot(Trange,GuRat1,c,'DisplayName',mnme1,'linewidth',2)
subplot(2,4,3)
hold on
VRat1=squeeze(VBR_3.out.anelastic.(anemeth).V(1,:,ifreq))/1e3;%./VBR_1.out.elastic.anh_poro.Vsu;
plot(Trange,VRat1,c,'DisplayName',mnme1,'linewidth',2)
subplot(2,4,4)
hold on
Q1=squeeze(VBR_3.out.anelastic.(anemeth).Q(1,:,ifreq))/1e3;%./VBR_1.out.elastic.anh_poro.Vsu;
semilogy(Trange,Q1,c,'DisplayName',mnme1,'linewidth',2)
subplot(2,4,6)
hold on
GuRat1=squeeze(VBR_3.out.anelastic.(anemeth).M(1,Tmask,ifreq))/1e9;%./VBR_1.out.elastic.anh_poro.Gu;
plot(Trange(Tmask),GuRat1,c,'DisplayName',mnme1,'linewidth',2)
subplot(2,4,7)
hold on
VRat1=squeeze(VBR_3.out.anelastic.(anemeth).V(1,Tmask,ifreq))/1e3;%./VBR_1.out.elastic.anh_poro.Vsu;
plot(Trange(Tmask),VRat1,c,'DisplayName',mnme1,'linewidth',2)
subplot(2,4,8)
hold on
Q1=squeeze(VBR_3.out.anelastic.(anemeth).Q(1,Tmask,ifreq))/1e3;%./VBR_1.out.elastic.anh_poro.Vsu;
semilogy(Trange(Tmask),Q1,c,'DisplayName',mnme1,'linewidth',2)
end
subplot(2,4,2)
legend('location','southwest');
hold on
plot([T_solidus_C,T_solidus_C],[60,75],'--k','linewidth',1.5,'DisplayName','T_{sol}')
box on; xlabel('T [C]'); ylabel('M [GPa]');
xlim([Tmin,Tmax]); ylim([60,75])
subplot(2,4,3)
hold on
plot([T_solidus_C,T_solidus_C],[4.2,4.9],'--k','linewidth',1.5,'DisplayName','T_{sol}')
box on; xlabel('T [C]'); ylabel('Vs_R [km/s]');xlim([Tmin,Tmax]); ylim([4.3,4.8])
subplot(2,4,4)
hold on
semilogy([T_solidus_C,T_solidus_C],[1e-2,1e4],'--k','linewidth',1.5,'DisplayName','T_{sol}')
box on; xlabel('T [C]'); ylabel('Q');xlim([Tmin,Tmax])
subplot(2,4,6)
hold on
plot([T_solidus_C,T_solidus_C],[60,70],'--k','linewidth',1.5,'DisplayName','T_{sol}')
box on; xlabel('T [C]'); ylabel('M [GPa]');xlim([Tmin2,Tmax]); ylim([62,69])
subplot(2,4,7)
hold on
plot([T_solidus_C,T_solidus_C],[4.3,4.9],'--k','linewidth',1.5,'DisplayName','T_{sol}')
box on; xlabel('T [C]'); ylabel('Vs_R [km/s]');xlim([Tmin2,Tmax]); ylim([4.3,4.6])
subplot(2,4,8)
hold on
semilogy([T_solidus_C,T_solidus_C],[1e-2,1e1],'--k','linewidth',1.5,'DisplayName','T_{sol}')
box on; xlabel('T [C]'); ylabel('Q');xlim([Tmin2,Tmax])
saveas(gcf,'./figures/CB_011_meltEffects_case2_fig2.png')
end
case2out.VBR_1=VBR_1;
case2out.VBR_2=VBR_2;
end
function VBR = appendFixedSVs(VBR,sz)
%%%%%%%%%%%%%%%%%%%%%%%%%%%%%%%%%%%%%%%%%%%%%%%%%%%%%%%%%%%%%%%%%%%%%%%%%%%
% VBR = appendFixedSVs(VBR,sz)
%
% appends fixed state variables to VBR.in.SV structure
%%%%%%%%%%%%%%%%%%%%%%%%%%%%%%%%%%%%%%%%%%%%%%%%%%%%%%%%%%%%%%%%%%%%%%%%%%%
VBR.in.SV.dg_um=0.01*1e6* ones(sz); % grain size [um]
VBR.in.SV.P_GPa = 2 * ones(sz); % pressure [GPa]
VBR.in.SV.rho = 3300 * ones(sz); % density [kg m^-3]
VBR.in.SV.sig_MPa = .1 * ones(sz); % differential stress [MPa]
VBR.in.SV.f = [0.01,0.02,0.1];
end
function Clrs=getMethodColors()
%%%%%%%%%%%%%%%%%%%%%%%%%%%%%%%%%%%%%%%%%%%%%%%%%%%%%%%%%%%%%%%%%%%%%%%%%%%
% Clrs=getMethodColors()
%
% builds a structure with line colors by method to ensure consistency between
% plots.
%
% Output
% ------
% Clrs structure with fieldname for each method, field value is a matlab
% color string
%%%%%%%%%%%%%%%%%%%%%%%%%%%%%%%%%%%%%%%%%%%%%%%%%%%%%%%%%%%%%%%%%%%%%%%%%%%
C={'k','r','b','c','m'};
meths={'eburgers_psp';'andrade_psp';'xfit_mxw';'xfit_premelt'};
for imeth=1:numel(meths)
Clrs.(meths{imeth})=C{imeth};
end
end