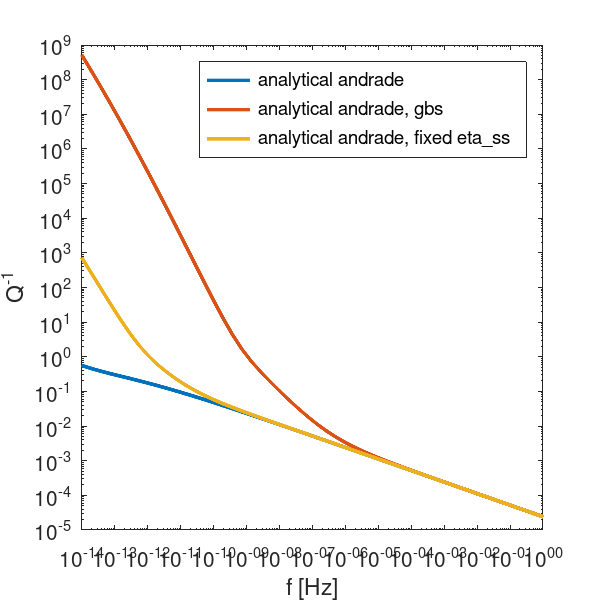
function VBR = CB_015_analytical_andrade()
     %%%%%%%%%%%%%%%%%%%%%%%%%%%%%%%%%%%%%%%%%%%%%%%%%%%%%%%%%%%%%%%%%%%%%%%%%%%
     %  CB_015_analytical_andrade
     %
     %  Runs a number of examples with the andrade_analytical anelastic method
     %%%%%%%%%%%%%%%%%%%%%%%%%%%%%%%%%%%%%%%%%%%%%%%%%%%%%%%%%%%%%%%%%%%%%%%%%%%

     %%%%%%%%%%%%%%%%%%%%%%%%%%%%%%%%%%%%%%%%%%%%%%%%%%%%%%%%%%%%%%%%%%%%%%%
     % Case 1 : default behavior
     % the analytical andrade method will pull unrelaxed modules from the
     % anharmonic output and the steady state viscosity from the first entry
     % in the viscous methods list
     %%%%%%%%%%%%%%%%%%%%%%%%%%%%%%%%%%%%%%%%%%%%%%%%%%%%%%%%%%%%%%%%%%%%%%%%

     VBR.in.elastic.methods_list={'anharmonic';};
     VBR.in.viscous.methods_list={'HZK2011'};
     VBR.in.anelastic.methods_list={'andrade_analytical';};

     %% Define the Thermodynamic State %%

     % set state variables
     n1 = 1;
     VBR.in.SV.P_GPa = 2 * ones(n1,1); % pressure [GPa]
     VBR.in.SV.T_K = 1473 * ones(n1,1); % temperature [K]
     VBR.in.SV.rho = 3300 * ones(n1,1); % density [kg m^-3]
     VBR.in.SV.sig_MPa = 10 * ones(n1,1); % differential stress [MPa]
     VBR.in.SV.phi = 0.0 * ones(n1,1); % melt fraction
     VBR.in.SV.dg_um = 0.01 * 1e6 * ones(n1,1); % grain size [um]

     % frequencies to calculate at
     VBR.in.SV.f = logspace(-14,0,50);

     % calculate!
     VBR = VBR_spine(VBR) ;

     % plot frequency dependence of attenuation
     if ~vbr_tests_are_running()
          figure('PaperPosition',[0,0,4,4],'PaperPositionMode','manual')
          loglog(VBR.in.SV.f, VBR.out.anelastic.andrade_analytical.Qinv, ...
               'displayname', 'analytical andrade', 'linewidth', 2)
          hold all
     end
     %%%%%%%%%%%%%%%%%%%%%%%%%%%%%%%%%%%%%%%%%%%%%%%%%%%%%%%%%%%%%%%%%%%%%%%%%%%%%%
     % Case 2 : change the viscosity deformation mechanism
     % The default behavior is for the analytical andrade model to use the
     % steady state diffusion creep viscosity from whatever viscous method is
     % being used. You can change this by setting the viscosity_method_mechanism
     % field.
     %%%%%%%%%%%%%%%%%%%%%%%%%%%%%%%%%%%%%%%%%%%%%%%%%%%%%%%%%%%%%%%%%%%%%%%%%%%%%%

     VBR = struct();
     VBR.in.elastic.methods_list={'anharmonic';};
     VBR.in.viscous.methods_list={'HZK2011'};
     VBR.in.anelastic.methods_list={'andrade_analytical';};

     % load in the parameter set then use set the viscosity method to use to
     % 'gbs' for diffusion-accomodated grain boundary viscosity.
     VBR.in.anelastic.andrade_analytical = Params_Anelastic('andrade_analytical');
     VBR.in.anelastic.andrade_analytical.viscosity_method_mechanism = 'gbs';

     % set state variables
     n1 = 1;
     VBR.in.SV.P_GPa = 2 * ones(n1,1); % pressure [GPa]
     VBR.in.SV.T_K = 1473 * ones(n1,1); % temperature [K]
     VBR.in.SV.rho = 3300 * ones(n1,1); % density [kg m^-3]
     VBR.in.SV.sig_MPa = 10 * ones(n1,1); % differential stress [MPa]
     VBR.in.SV.phi = 0.0 * ones(n1,1); % melt fraction
     VBR.in.SV.dg_um = 0.01 * 1e6 * ones(n1,1); % grain size [um]
     VBR.in.SV.f = logspace(-14,0,50);

     % calculate!
     VBR = VBR_spine(VBR) ;

     % plot frequency dependence of attenuation
     if ~vbr_tests_are_running()
          loglog(VBR.in.SV.f, VBR.out.anelastic.andrade_analytical.Qinv, ...
               'displayname', 'analytical andrade, gbs', 'linewidth', 2)
     end

     %%%%%%%%%%%%%%%%%%%%%%%%%%%%%%%%%%%%%%%%%%%%%%%%%%%%%%%%%%%%%%%%%%%%%%%%%%%%%%
     % Case 3 : directly specify the viscosity to use
     % Finally, the viscosity_method parameter can be set to 'calculated' (the
     % default) or 'fixed'. If 'fixed', then it will use the value from
     % the eta_ss field. The value can be a scalar or an array of the same size
     % as the standard state variable arrays.
     %%%%%%%%%%%%%%%%%%%%%%%%%%%%%%%%%%%%%%%%%%%%%%%%%%%%%%%%%%%%%%%%%%%%%%%%%%%%%%

     VBR = struct();
     VBR.in.elastic.methods_list={'anharmonic';};
     VBR.in.anelastic.methods_list={'andrade_analytical';};

     % load in the parameter set then use set the viscosity method to use to
     % 'gbs' for diffusion-accomodated grain boundary viscosity.
     VBR.in.anelastic.andrade_analytical = Params_Anelastic('andrade_analytical');
     VBR.in.anelastic.andrade_analytical.viscosity_method = 'fixed';
     VBR.in.anelastic.andrade_analytical.eta_ss = 1e22;

     % set state variables
     n1 = 1;
     VBR.in.SV.P_GPa = 2 * ones(n1,1); % pressure [GPa]
     VBR.in.SV.T_K = 1473 * ones(n1,1); % temperature [K]
     VBR.in.SV.rho = 3300 * ones(n1,1); % density [kg m^-3]
     VBR.in.SV.f = logspace(-14,0,50);

     % calculate!
     VBR = VBR_spine(VBR) ;

     % plot frequency dependence of attenuation
     if ~vbr_tests_are_running()
          loglog(VBR.in.SV.f, VBR.out.anelastic.andrade_analytical.Qinv, ...
               'displayname', 'analytical andrade, fixed eta\_ss', 'linewidth', 2)
          xlabel('f [Hz]')
          ylabel('Q^{-1}')
          legend()
          saveas(gcf,'./figures/CB_015_analytical_andrade.png')
     end
end
