function VBR = CB_016_complex_viscosity()
%%%%%%%%%%%%%%%%%%%%%%%%%%%%%%%%%%%%%%%%%%%%%%%%%%%%%%%%%%%%%%%%%%%%%%%%%%%
% CB_016_complex_viscosity
%
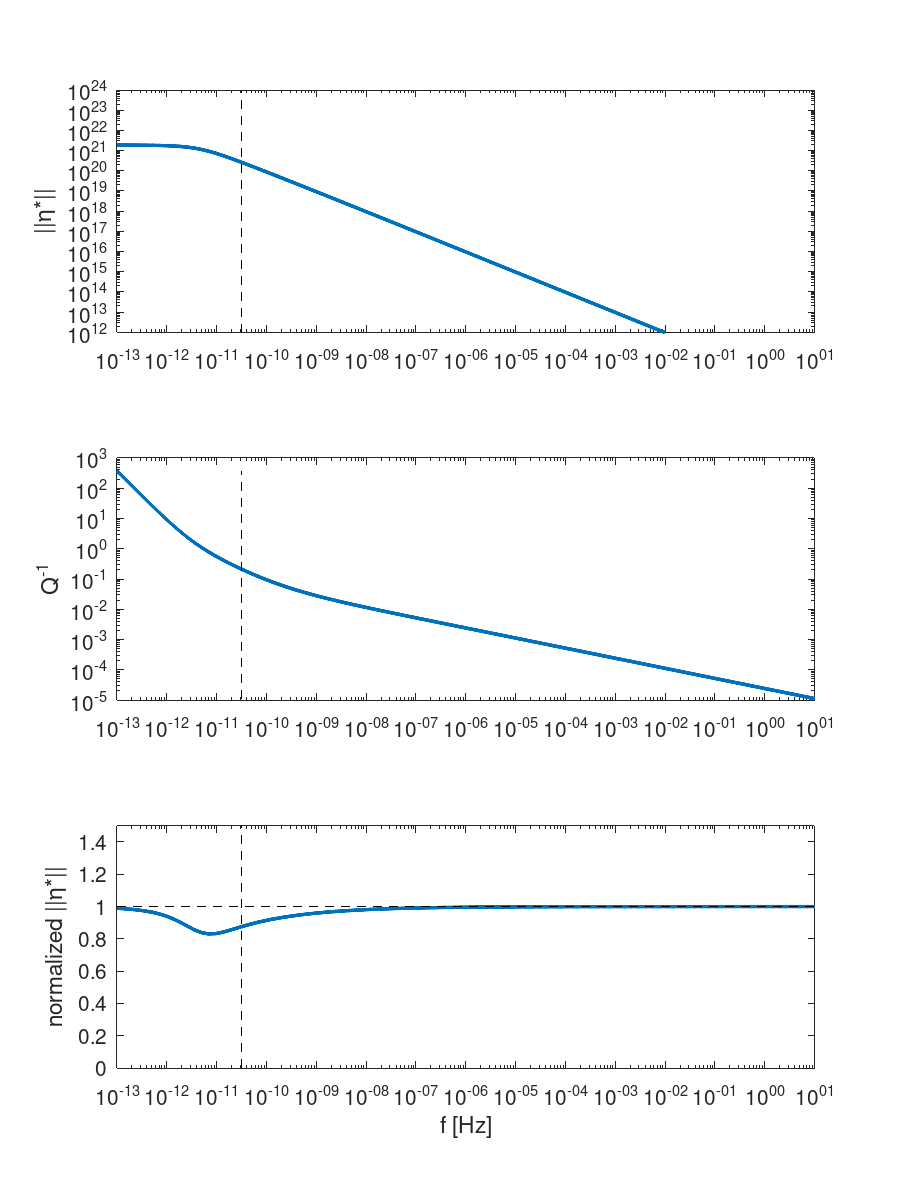
% reproduces the andrade model curve from Fig. 2 of Lau and Holtzman, 2019, GRL,
% https://doi.org/10.1029/2019GL083529
%%%%%%%%%%%%%%%%%%%%%%%%%%%%%%%%%%%%%%%%%%%%%%%%%%%%%%%%%%%%%%%%%%%%%%%%%%%
VBR = struct();
VBR.in.elastic.methods_list={'anharmonic';};
VBR.in.anelastic.methods_list={'andrade_analytical';};
% load in the parameter set then use set the viscosity method to use to
% a fixed, constant value for the steady state viscosity.
% the value here corresponds to the maxwell viscosity for a maxwell time of
% 1000 years and an unrelaxed modulus of 60 GPa.
VBR.in.anelastic.andrade_analytical = Params_Anelastic('andrade_analytical');
VBR.in.anelastic.andrade_analytical.viscosity_method = 'fixed';
VBR.in.anelastic.andrade_analytical.eta_ss = 1.888272e+21;
% set state variables
n1 = 1;
VBR.in.SV.rho = 3300 * ones(n1,1); % density [kg m^-3]
VBR.in.SV.P_GPa = 2 * ones(n1,1); % pressure [GPa]
VBR.in.SV.T_K = 1473 * ones(n1,1); % temperature [K]
VBR.in.SV.f = logspace(-13,1,100);
VBR.in.elastic.Gu_TP = 60*1e9;
VBR.in.elastic.quiet = 1;
VBR = VBR_spine(VBR) ;
% extract variables for convenience
tau_M = VBR.out.anelastic.andrade_analytical.tau_M;
omega = 2 * pi * VBR.in.SV.f;
eta_ss = VBR.in.anelastic.andrade_analytical.eta_ss;
J1 = VBR.out.anelastic.andrade_analytical.J1;
J2 = VBR.out.anelastic.andrade_analytical.J2;
J = J1 - J2 * i;
M = 1./J;
% complex viscosity
eta_star= -i * M ./ omega; % complex viscosity
% apparent viscosity
eta_app = abs(eta_star);
% complex maxwell viscosity
M_maxwell = i * omega * eta_ss ./(1.+i*omega * tau_M);
eta_maxwell = -i * M_maxwell ./ omega;
% maxwell-normalized apparent viscosity
eta_normalized = abs(eta_star) ./ abs(eta_maxwell);
tau_f = 1./ tau_M;
if ~vbr_tests_are_running()
figure('PaperPosition',[0,0,6,8],'PaperPositionMode','manual')
subplot(3,1,1)
loglog(VBR.in.SV.f, eta_app, 'linewidth', 2)
hold on
loglog([tau_f, tau_f], [1e12,1e24],'--k')
ylim([1e12,1e24])
ylabel('||\eta*||')
subplot(3,1,2)
Qinv = VBR.out.anelastic.andrade_analytical.Qinv;
loglog(VBR.in.SV.f, Qinv, 'linewidth', 2)
hold on
loglog([tau_f, tau_f], [min(Qinv), max(Qinv)],'--k')
ylabel('Q^{-1}')
subplot(3,1,3)
semilogx(VBR.in.SV.f, eta_normalized, 'linewidth', 2)
hold on
semilogx([tau_f, tau_f], [0, 1.5],'--k')
semilogx([VBR.in.SV.f(1), VBR.in.SV.f(end)], [1,1],'--k')
ylabel('normalized ||{\eta}*||')
xlabel('f [Hz]')
ylim([0, 1.5])
saveas(gcf,'./figures/CB_016_complex_viscosity.png')
end
end