function VBR = CB_020_uppermantle_reference_values()
%%%%%%%%%%%%%%%%%%%%%%%%%%%%%%%%%%%%%%%%%%%%%%%%%%%%%%%%%%%%%%%%%%%%%%%%%%%
% CB_020_uppermantle_reference_values.m
%
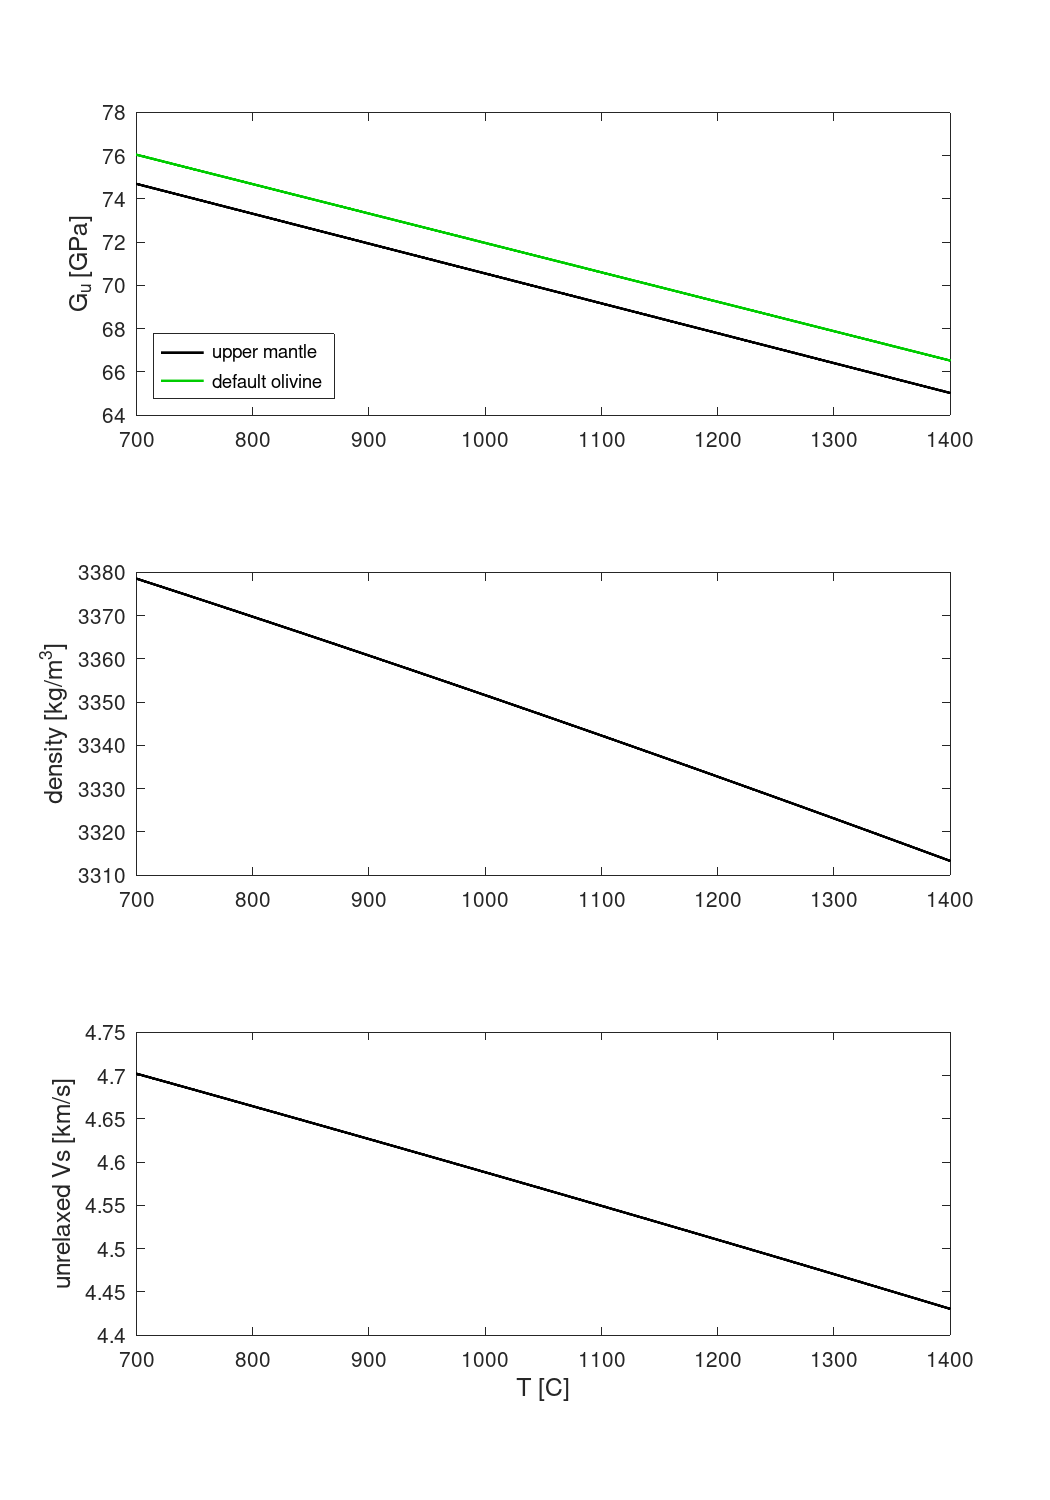
% Demonstrates usage of the upper mantle scaling
% calculating unrelaxed moduli as a function of temperature at a fixed
% pressure of 3 GPa.
%%%%%%%%%%%%%%%%%%%%%%%%%%%%%%%%%%%%%%%%%%%%%%%%%%%%%%%%%%%%%%%%%%%%%%%%%%%
VBR = struct();
% use upper_mantle for reference, temperature and pressure scaling
VBR.in.elastic.methods_list={'anharmonic';};
VBR.in.elastic.anharmonic.reference_scaling = 'upper_mantle';
VBR.in.elastic.anharmonic.temperature_scaling = 'upper_mantle';
VBR.in.elastic.anharmonic.pressure_scaling = 'upper_mantle';
VBR.in.SV.T_K = linspace(700, 1400, 100)+273;
sz_T = size(VBR.in.SV.T_K);
VBR.in.SV.P_GPa = full_nd(3, sz_T);
% calculate a density
rho = density_from_vbrc(VBR.in.SV.P_GPa*1e9, VBR.in.SV.T_K, ...
'reference_scaling', 'upper_mantle', ...
'pressure_scaling', 'upper_mantle');
VBR.in.SV.rho = rho;
VBR = VBR_spine(VBR);
% calculate a default case at same conditions
VBR2 = struct();
VBR2.in.elastic.methods_list={'anharmonic';};
VBR2.in.SV = VBR.in.SV;
VBR2 = VBR_spine(VBR2);
if ~vbr_tests_are_running()
figure('PaperPosition',[0,0,7,10],'PaperPositionMode','manual')
subplot(3,1,1)
T_C = VBR.in.SV.T_K-273;
plot(T_C, VBR.out.elastic.anharmonic.Gu/1e9,'k',...
'displayname','upper mantle', 'linewidth',1.5)
ylabel("G_u [GPa]", 'fontsize',12)
hold on
plot(T_C, VBR2.out.elastic.anharmonic.Gu/1e9,'color',[0,0.8,0.],...
'displayname','default olivine', 'linewidth',1.5)
legend('location', 'southwest')
subplot(3,1,2)
plot(T_C, rho, 'k','linewidth',1.5)
ylabel("density [kg/m^3]",'fontsize',12)
subplot(3,1,3)
plot(T_C, VBR.out.elastic.anharmonic.Vsu/1e3, 'k','linewidth',1.5)
ylabel('unrelaxed Vs [km/s]','fontsize',12)
xlabel("T [C]", 'fontsize',12)
saveas(gcf,'./figures/CB_020_uppermantle_reference_values.png')
end
end